Wasabi keys state generation
2023-01-02
Create a visual representation from a Wasabi kyes dump.
How to run it
Run Wasabi, open the wallet you are interested in.
Next open a terminal and enter:
dotnet fsi keysgraph.fsx <wallet-name>The result
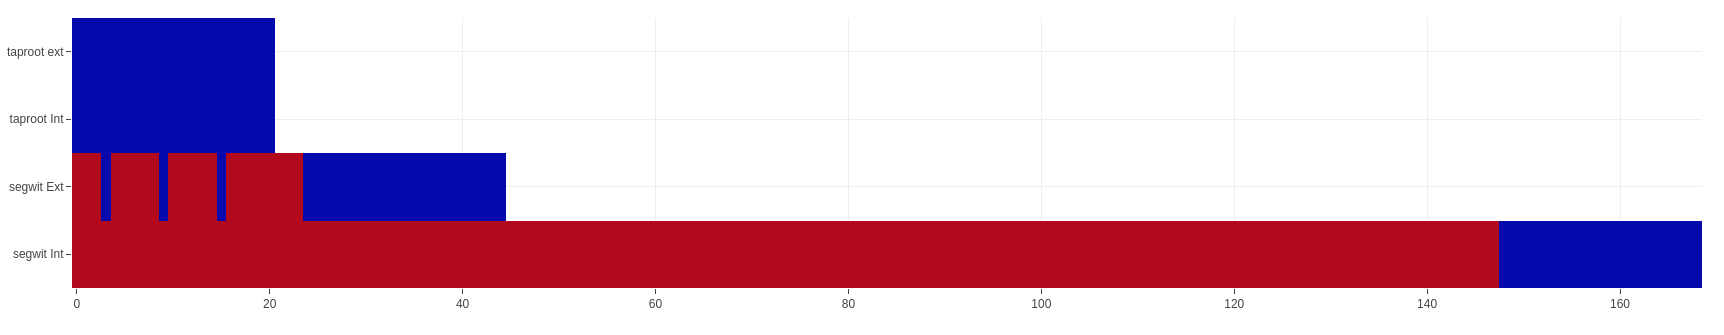
The Code
#r "nuget:FSharp.Data"
#r "nuget:Plotly.NET"
#r "nuget:Plotly.NET.ImageExport"

open System
open System.IO
open Plotly.NET
open Plotly.NET.ImageExport
open System.Net.Http
open FSharp.Data

type Config = JsonProvider<"""{
  "JsonRpcServerEnabled": true,
  "JsonRpcUser": "",
  "JsonRpcPassword": "",
  "JsonRpcServerPrefixes": [
    "http://127.0.0.1:37128/"
  ]
}""">

type RpcResponse = JsonProvider<"""{
  "result": [
     {"fullKeyPath":"xxxx","keyState":0}
  ]
}""">

let config = Config.Load(
  Path.Combine (
    Environment.ExpandEnvironmentVariables ("%HOME%/.walletwasabi/client/"),
    "Config.json"))

let args = Environment.GetCommandLineArgs()
let walletname = args[2]

let http = new HttpClient()
let rpcJsonResponseAsync () = async {
  let content = new StringContent ($"{{\"jsonrpc\":\"2.0\", \"id\":\"id\", \"method\":\"selectwallet\", \"params\":[\"{walletname}\"]}}")
  let! response = http.PostAsync(config.JsonRpcServerPrefixes[0], content) |> Async.AwaitTask

  let content = new StringContent ("{\"jsonrpc\":\"2.0\", \"id\":\"id\", \"method\":\"listkeys\"}")
  let! response = http.PostAsync(config.JsonRpcServerPrefixes[0], content) |> Async.AwaitTask
  let! jsonResult = response.Content.ReadAsStringAsync() |> Async.AwaitTask
  return RpcResponse.Parse(jsonResult)
}

let rpcJsonResult = rpcJsonResponseAsync () |> Async.RunSynchronously
type KeyInfo = { Path: string; State: int }

let keys =
    rpcJsonResult.Result
    |> Array.map (fun x -> { Path=x.FullKeyPath; State=x.KeyState })
    |> List.ofArray

let filterByKeyPath (keys: KeyInfo list) (kp: string) =
    keys
    |> List.filter (fun k -> k.Path.StartsWith kp)
    |> List.sortBy (fun k -> int <| Array.last (k.Path.Split [|'/'|]))

let stateToHeat (key: KeyInfo) =
    key.State

let intSegwit = filterByKeyPath keys "84'/1'/0'/1" |> List.map stateToHeat
let extSegwit = filterByKeyPath keys "84'/1'/0'/0" |> List.map stateToHeat
let intTaproot= filterByKeyPath keys "86'/1'/0'/1" |> List.map stateToHeat
let extTaproot= filterByKeyPath keys "86'/1'/0'/0" |> List.map stateToHeat

let matrix = [ intSegwit; extSegwit; intTaproot; extTaproot ]

let rownames = ["segwit Int"; "segwit Ext"; "taproot Int"; "taproot ext"]
let colnames = []

let heat =
    Chart.Heatmap(
        matrix,
        colnames,
        rownames,
        UseDefaults = false
    )

heat |> Chart.show
Dependencies
None